
The default Claude Code status line is fine until the moment you actually need it. You're deep in a session, you fire off one more request, and you hit a rate limit you had no warning was coming. The information to avoid that is sitting right there in the payload Claude Code hands every status line script. You just have to draw it.
I wanted three things on screen at all times: which model I'm talking to, which repo and branch I'm in (as a link I can click), and how close I am to my context window and rate limits. Here's how the script that produces that comes together.
How the data arrives
Claude Code reads statusLine from ~/.claude/settings.json and runs your command after every turn, piping a JSON blob to standard input:
{
  "statusLine": {
    "type": "command",
    "command": "~/.claude/statusline.sh",
    "padding": 0
  }
}
The script reads that blob from stdin once and pulls fields out with jq. A small helper keeps the call sites readable:
input=$(cat)

read_field() {
  printf '%s' "$input" | jq -r "$1" 2>/dev/null
}

MODEL=$(read_field '.model.display_name // empty')
PCT=$(read_field '.context_window.used_percentage // 0' | cut -d. -f1)
FIVE_H=$(read_field '.rate_limits.five_hour.used_percentage // empty')
WEEK=$(read_field '.rate_limits.seven_day.used_percentage // empty')
The // empty fallbacks matter. context_window.used_percentage is always there, but rate_limits only shows up for Pro and Max subscribers, and only after the first API response of a session. So FIVE_H and WEEK can be empty, and the script has to handle that gracefully rather than printing a broken bar.
Drawing the bars
A usage number means more at a glance as a bar than as a percentage. make_bar takes a percent, clamps it, picks a color based on how full it is, and prints ten filled or empty block characters:
make_bar() {
  local pct="${1:-0}"
  pct="${pct%%.*}"
  [ "$pct" -gt 100 ] 2>/dev/null && pct=100
  [ "$pct" -lt 0 ] 2>/dev/null && pct=0

  local color="$GREEN"
  if [ "$pct" -ge 90 ]; then
    color="$RED"
  elif [ "$pct" -ge 70 ]; then
    color="$YELLOW"
  fi

  local filled=$((pct / 10))
  local empty=$((10 - filled))
  local fill pad
  printf -v fill "%${filled}s"
  printf -v pad "%${empty}s"
  printf '%s' "${color}${fill// /█}${pad// /░}${RESET} ${pct}%"
}
The printf -v trick builds a string of N spaces, then ${fill// /█} swaps every space for a block. Green stays green until 70%, turns yellow as a heads-up, and goes red past 90% so a near-limit window is impossible to miss. The rate-limit fields get a wrapper that prints a dim placeholder until the data exists:
rate_bar() {
  local value="$1"
  if [ -n "$value" ]; then
    make_bar "$value"
    return
  fi
  printf '%s' "${DIM}░░░░░░░░░░${RESET} ?"
}
The resets_at fields are Unix epoch seconds, so a small date helper turns them into a readable 6pm or Sat 8pm, with the weekday added only for the seven-day window since it can land on a different day.
The clickable repo link
Terminals that support OSC 8 hyperlinks let you wrap text in an escape sequence so it becomes a real link. The format is \e]8;;URL\a TEXT \e]8;;\a. To make it useful I convert the git remote into an HTTPS URL, handling the SSH forms most people actually use:
remote_to_https() {
  local url="$1"
  case "$url" in
    git@*:*)
      local host="${url#git@}"; host="${host%%:*}"
      local path="${url#*:}"
      url="https://${host}/${path}"
      ;;
  esac
  printf '%s' "${url%.git}"
}
Because it keeps whatever host the remote uses, the same code links correctly whether the repo lives on GitHub, GitLab.com, or a self-hosted instance. Wrap the repo/branch label in the OSC 8 sequence and the status line turns into a one-click jump to the remote.
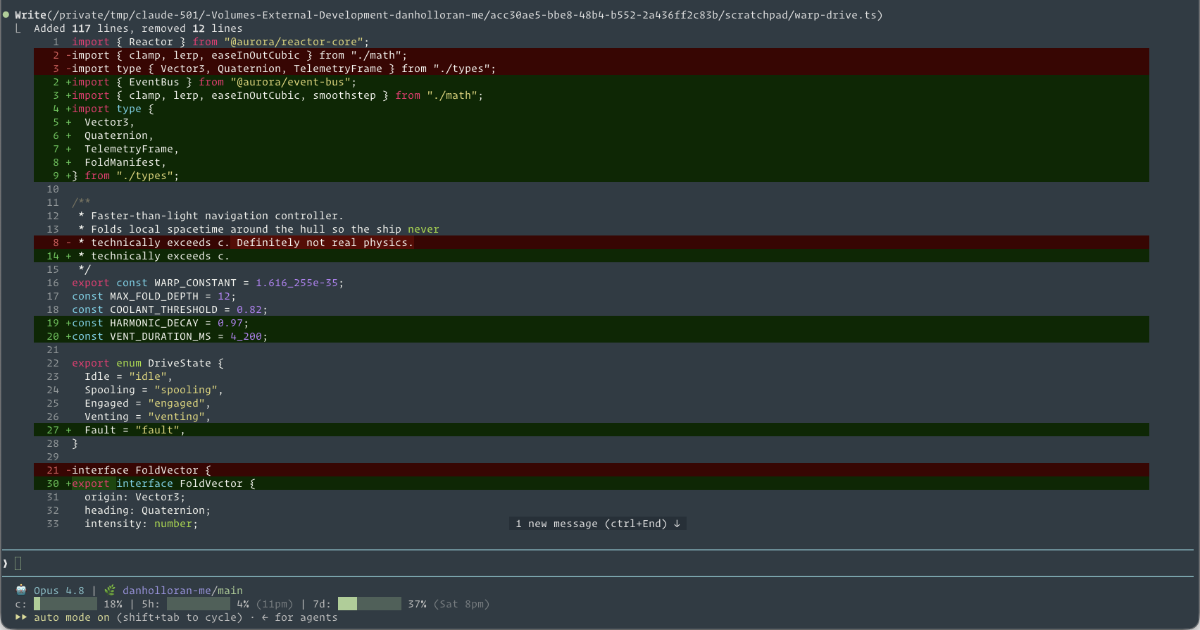
The result is two compact lines: model and a linked repo on top, three colored usage bars with reset times underneath. It took maybe an afternoon to write, and it has already saved me from walking into a rate limit blind more than once. If you want to build your own, the Claude Code status line docs list every field in the payload, which is the real starting point.